
RINA 2011
When Given a Lemon, Make Lemonade
| Location | Paamul, Quintana Roo, MEXICO |
|---|---|
| Date | 27-28 Oct 2011 |
| Intensity | Tropical Storm |
| Partner | Solo |
This chase was a big bust. I flew to the Yucatan Peninsula for a major hurricane—but Rina rapidly unraveled and came ashore as a tropical storm. Still, it was a fun little chase, and a successful one in its own way: I perfectly nailed the center at landfall, and I collected data which helped the National Hurricane Center with their postanalysis of the system. In the end, I made the most of a disappointing situation.
Chase Report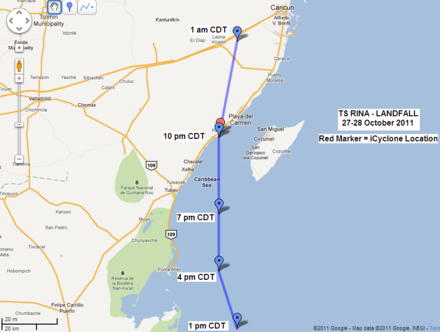
Of course, Rina wasn't worth traveling from California to experience—obviously not—but, hey, I was there and I made the most of it. Rina sucked but the chase was a success. I wanted to punch the center and that's what I did. I got right in it—a bullseye—and collected valuable and relevant data. (Yeah, I'm patting myself on the back—I've got to do something after coming from California to chase a sheared tropical storm!)
It was cool to really observe/document the component parts of a tropical cyclone as it passed right over my location. And unlike Don, Rina actually did still have an intact structure and observable tropical-cyclone components: a sharp pressure dip, a tight wind core (with front side and backside), a central calm bookended by periods of rain/wind, and a sharp directional shift in the wind after the center passed and the pressure started rising. (We had none of these things in Don.) Rina was weakened and hurting, but the "bones" were still in place. There was still structure. And the frequent lightning was a small bonus.
I shot no video of Rina. I have no desire to dilute my portfolio with tropical-storm footage—seems kind of lackluster—so I didn't even turn on the camera. You know what, though? It was kind of cool and liberating to not have to shoot video, and it allowed me to concentrate more on observations. So it was a different kind of chase.
From a weather-nerd/data-collection standpoint, this chase was awesome.
Quick summary of the chase's particulars. (All times are CDT and rounded to nearest 5 mins unless it's the time of actual, recorded data.)
1. Location & Time
- My exact location was 20.522478N 87.192073W—right on a waterfront patio in a private community in Paamul, on the E coast of the Yucatan Peninsula.
- I was at this spot from ~8:00 pm to ~11:25 pm.
- The elevation where I kept the barometer was ~10 ft, and the barometer was calibrated (for sea-level readings) using that value.

2. Observations
Front Side
- The starting pressure at this location was 1001.5 mb.
- Strong, gusty winds (along with moderate rain) started at ~8:20 pm and went until ~8:45 pm. During this time, the pressure dropped fast.
Center
- At ~8:45 pm, it started to calm, and by ~8:55 pm, it had stopped raining.
- The lull lasted until ~9:25 pm. Lowest pressure during this lull was 996.5 mb, recorded at 9:12 pm.
- The NHC's 10 pm CDT advisory position (20.5N 87.2W) was almost exactly at my location, altlough apparently late by about an hour (when compared with my pressure observations).
Note: I sent these data to the National Hurricane Center, and in seasonal postanalysis, they shifted Rina's landfall time one hour earlier—to 0200Z (9 pm CDT)—to match my low-pressure time of 0212Z.
- My lowest pressure corresponds very nicely with the NHC's official landfall pressure (from recon) of 996 mb.
Backside
- Around ~9:20 pm, there was a marked shift in the wind's direction and it was picking up speed again. The pressure was 997.0 mb and rising.
- At ~9:25 pm, the wind became gusty, and it started raining lightly. The pressure was 997.6 mb and rising rapidly.
- The wind increased and became quite strong for an hour, blowing mostly from the SW—from a little after 10 pm to a little after 11 pm. During this time—a solid hour—the average wind speed was 20 kt (sample rate = 30 secs), with frequent, extended periods of steady 25+ kt, and a peak gust of 33 kt (at 10:16 pm). These measurements were taken on a patio on the open beach, so the exposure was pretty good—however, the instrument's height was only ~4 m, so true winds (at 10 m) were most certainly higher. During this period of strong winds, there was very little rain.
- By ~11:05 pm, the winds were down to 15 kt and slacking.
Other Observations
- There was frequent, brilliant lightning—both before and after the center passed. (In fact, there was just a flash and a loud clap of thunder here in Playa del Carmen.)
- I saw very little damage on the drive back up from Paamul to Playa del Carmen—just some downed branches and localized power outages.
3. Detailed Data
Here are two graphs of my data:
A barogram from the time I was at a fixed location (in Paamul). As mentioned above, in seasonal postanalysis, the NHC adjusted the landfall time from the operational 10 pm CDT to 9 pm (0200Z) to correspond better with my pressure data. (Note: During the strong winds on the backside, I held the instrument high over my head to take wind readings—so that may have slightly affected the air-pressure values from ~10 to 11 pm.)

A wind trace for the hour that I took measurements—from ~10 pm to ~11 pm CDT. This was a period of suddenly vigorous winds—blowing from the SW—after the center/lull passed. During this time, I stood on the beachfront patio holding the Kestrel over my head (yes, continuously for an hour—my arms were aching from it). The sample rate was 30 secs, which is very low-res for wind data—a lot is missed. The patio was slightly elevated, so the height of the instrument was ~4 m; the winds were of course higher at the standard 10 m. These winds are nothing to write home about, but they show that Rina still had tight, vigorous surface circulation at this time. The highest winds at landfall occurred not where I was, but E of the center, in the vicinity of Cozumel.

Don't try to match the two graphs vertically—they're showing very different sample periods! The barogram is a ~3.5-hr period, whereas the wind trace is just for ~1 hr within that time.